Hypothesis Testing
Hypothesis Testing
A hypothesis is a claim or statement about a parameter1. There are two types of statistical hypotheses: - Null Hypothesis - Alternative Hypothesis
A null hypothesis is a statement that claims that the parameter is equal to some claimed value. - H0 is the symbol used to denote this. It can be pronounced as “H null”, “H zero” or “H nought” - It always contains one of these operators: \(\ge\), \(\le\), =. - This value is the one to always assume is true.
An alternative hypothesis is a statement that claims that the parameter is a different value than the null. - HA or H1 is the symbol used to denote this. It’s always called “alternative hypothesis.” - It always contains one of these operators: \(\gt\), \(\lt\), \(\neq\).
Steps to Solving a Hypothesis Test Problem
- Write and label everything.
- Write hypotheses:
- H0: (operator with equal sign)
- HA: (operator without equal sign)
- Draw graph (bell-curved)
- The graph will either be right, left or two tailed.
- Carry out the necessary calculations to arrive to a solution.
- This can involve solving a t-statisic or z-test.
- Write a sentence summarizing the findings.
- Usually follows this format: “There is/is not sufficient evidence to support/reject the claim that…”
Rejection Explained
Every hypothesis test is rejected or failed to reject. This is because we either have enough data to be able to say the hypothesis is correct, or we don’t have enough data to prove otherwise. To determine this, we compare the significance level to the p-value .
The significance level is denoted by \(\alpha\) which measures how strong the evidence must be in order to determine the evidence to be statistically significant.
P-value is defined by Investopedia as “a statistical measurement used to validate a hypothesis against observed data.” We’re not going to go in-depth here regarding how the p-value is calculated, but just enough to scratch the surface. This value describes the likelihood of the data occurring randomly. P-values range from 0 to 1 and a smaller p-value denotes a smaller probability that the results occurred randomly.
- If p-value \(\leq\) \(\alpha\), then reject H0.
- If p-value \(\gt\) \(\alpha\), then fail to reject H0.
Determining the Tail of the Curve
The trick to remembering where the tail of the curve is by looking at the alternative hypothesis. - If the sign in HA is - \(\neq\): two-tailed - \(\lt\): left-taied - \(\gt\): right-tailed
Errors
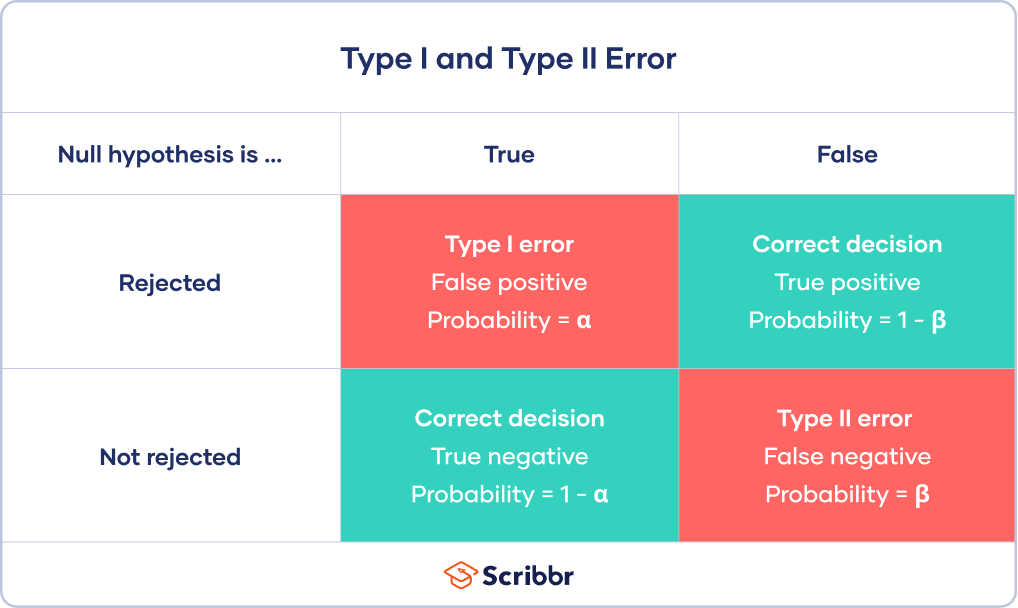
Sometimes, error occurs with hypothesis testing and there are two types of it: - Type I error - This is known as the false-positive. - It occurs when the null hypothesis is rejected, but it is true. - Type II error - This is known as the false-negative. - It occurs when the null hypothesis is not rejected, but it is false.
This table below from Scribbr can be used to determine error type, if any.
1A parameter is a measure done on an entire population of data.